
Assessing the Costs of Rolling Over Government Debt
In the span of about one year, the Federal Open Market Committee (FOMC) has raised the federal funds target rate from near zero to around 5%. This has driven up other rates—mortgages, US Treasuries, bank loans, etc. Given the high speed at which rates have risen, there are concerns about the cost of rolling over the existing debt for firms, households, and governments. Specifically, when debt matures, issuers must decide whether to "roll over" their debt—by issuing new debt at the current rate—or find other resources to repay the debt.
Take for example a small business owner who, in 2020, at the beginning of the COVID-19 crisis, borrowed at a 3% interest rate with a three-year maturity. This year, when the owner returns to the bank to discuss the rollover of the loan, they will likely be quoted a rate that is double to triple their existing rate. This creates a difficult choice for the business owner: maintain the same amount of debt and pay double or triple in interest or reduce their level of debt and cut costs.
This trade-off applies to any debt issuers, e.g., the US government. In the fourth quarter of 2022, the total public debt, according to the US Treasury Department, was just over $31.4 trillion.1 Below, we show a breakdown of this debt:

Of those $31.4 trillion, about $7.5 trillion or 23.9% is nonmarketable debt—mainly consisting of the social security trust fund, military retirement funds, and the civil service retirement fund. Of the remaining $23.9 trillion in marketable debt, there is $2.5 trillion in variable-rate debt. Specifically, there are Treasury inflation-protected securities (TIPS) and floating-rate notes (FRN).2 TIPS make up 6% of the US debt, have maturities of 5, 10, or 30 years, and their interest payments are adjusted based on inflation. FRNs make up only 2% of US debt, have maturity of 2 years, and interest payments are based on a fixed spread and a variable index rate calculated weekly. Finally, there are $21.4 trillion in fixed-rate marketable securities. This final category contains bills, notes, and bonds, which make up 11.8%, 43.6%, and 12.7% of the US debt, respectively. The only difference between these three categories is the length of maturity: Bills have maturity of one year or less; notes have maturity of 2, 3, 5, 7, or 10 years; and bonds have maturity of 20 or 30 years.3 For the remainder of the essay, we will consider only the fixed-rate marketable portion of the U.S. debt (FRMUSD), consisting of bills, notes, and bonds and making up 68.1% of the US debt.
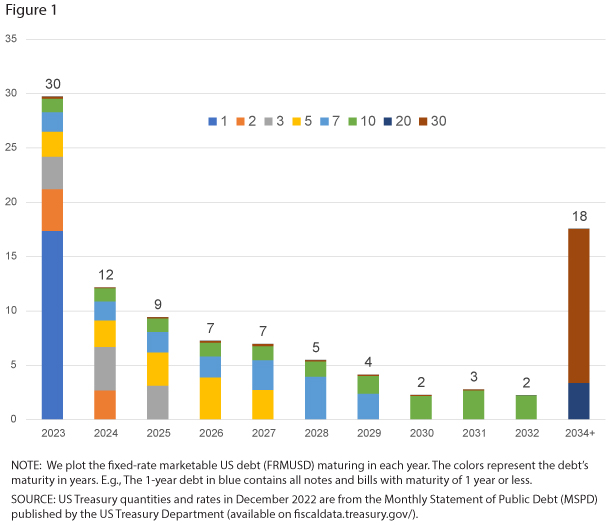
We take a snapshot of FRMUSD in December 2022 and decompose the debt by when securities are maturing and how long their maturity was at issuance.4 Specifically, in Figure 1, we plot the debt maturing in each year, broken down in different colors by the debt's maturity. For example, the orange portion of the 2023 column represents two-year US Treasury debt maturing in the year 2023. About 30% of existing FRMUSD is maturing in 2023. Of course, this figure does not account for short-term debt that we expect will be issued in 2023. (This is why there is no 1-year debt maturing in 2024 or later: It has not been issued yet.) The figure also shows nearly 62% of existing FRMUSD is coming due in the nine years after 2023. Finally, 18% of existing FRMUSD is very long and will not come due for at least 10 years.
Aside from quantity and maturity, we also look at the yield of the debt. To assess the debt rollover pressure on the US government, we estimate the interest payments the government is making compared with the size of US GDP. First, we compute the interest expense as a percent of GDP as the following:

The interest expense is simply the summation of the product of the interest rate on security with maturity j and the amount of debt with maturity j.5 Then, we divide by GDP to compare the interest expense with the U.S. economy. We use data on quantities and prices from December 2022 and compare it with the interest expense the US government would pay on the same quantity of debt using the new, higher interest rates in April 2023. Here, we assume that the US government will keep the same debt schedule as in 2022. In other words, for any debt maturing during 2023, the government will issue another security with the same quantity and maturity—but at the new interest rate. We define short-term debt as any security with maturity less than or equal to one year and long-term debt as any security with maturity greater than one year.
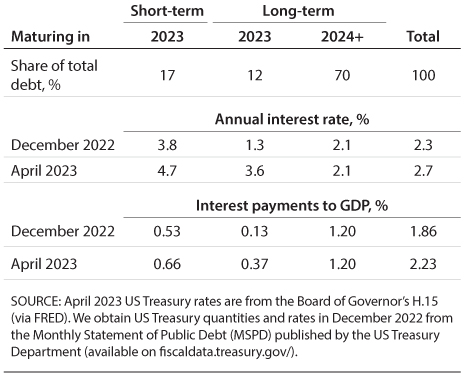
Short-term debt maturing in 2023 makes up about 17% of the existing FRMUSD. However, because this debt is short term, most of it had already been rolled over at higher interest rates in 2022. The December 2022 average rate on the short-term debt was already 3.8% and therefore increased only 0.9%—to 4.7%—in April. The long-term debt maturing in 2023 is almost 12% of debt, and the average rate increases from 1.3% to 3.6%, which is fairly large. Long-term debt maturing after 2024 will have the same interest rate, since the federal government is not rolling it over in 2023. Long-term debt makes up just over 70% of the existing debt.
Next, we assess the overall effect of the higher interest rates on the interest payments as a percentage of GDP. Since the short-term debt was already repriced, our estimated increase on interest payments for that debt is small, from 0.53% of GDP to 0.66%. The long-term debt maturing in 2023 makes up a smaller portion of the debt, and therefore estimated interest payments increase only from 0.13% to 0.37% of GDP. Overall, we estimate the total US interest payments over GDP increases from 1.86% to 2.23%. This 0.37% increase, while seemingly small, equates to about $98 billion more paid on interest.
To get some idea of the magnitude of $98 billion, we provide two examples: First, the Federal Reserve pays the Treasury Department remittances, which basically contain all remaining Fed revenue after operating expense.6 Fed remittances were $105 billion in 2021 and were negative $54 billion in 2022, in part due to the increases in interest rates. In 2021, this was an example of an inflow, or payment, to the government. Second, an example of an outflow, or expense incurred by the government, the US Department of Transportation spent $114 billion in 2022.7

Finally, we can compare our calculations with what the Congressional Budget Office (CBO) has forecasted for interest expense payments over GDP in the next 10 years. The CBO's projections include variable-rate marketable securities—TIPS and FRNs—and thus we expect them to be slightly higher than our estimates, which contain only FRMUSD. In 2022, they recorded 1.9% interest payments over GDP, closely aligning with our estimates. In 2023, they estimate an increase to 2.4% interest payments over GDP, slightly higher than our estimated increase. The big question is what will happen in the medium and long term—that is, in 2024 and beyond. However, this requires projections for the path of fiscal and monetary policies, which are out of the scope of this essay. For example, CBO projects interest expenses to GDP to increase from 1.9% to 3.6% in the next 10 years.
In conclusion, the US government had $21.4 trillion in outstanding US Treasury debt as of December 2022. Given large increases to interest rates over the past year, we estimate that it will cost the US government an additional $98 billion to pay interest on their debt in 2023. This estimate is close to those made by the CBO. Overall, we conclude that pressures associated with rolling over the US government FRMUSD maturing in 2023, while large in absolute terms, are relatively small compared with the size of the US economy. However, the longer interest rates stay high, more and more of the FRMUSD will be rolled over at higher rates, continuing to cause interest payments by the government to become a larger and larger portion of the budget.
Notes
1 Of this $31.4 trillion, the Federal Reserve owns about $6 trillion. An additional $7.5 trillion is nonmarketable debt held by federal agencies.
2 TIPS have a fixed, real rate. However, since the nominal interest being paid is variable, we classify TIPS as variable rate for the purpose of this essay.
3 For more information on marketable securities, see About Treasury Marketable Securities — TreasuryDirect.
4 Detailed information about the composition of U.S. Treasury debt is available in the Monthly Statement of Public Debt (MSPD) dataset – published by the U.S. Treasury Department.
5 Some Treasury bills are discount bills, meaning they pay a par value at maturity that is higher than the original price paid, as opposed to paying interest regularly and paying the principal back at maturity. Thus, discount bills do not have a coupon rate. However, for all FRMUSD, we use the yield provided by the MSPD instead of the coupon, so we have yield data for the discount bills.
6 For more information on Fed remittances, see Fed Payments to Treasury and Rising Interest Rates | St. Louis Fed (stlouisfed.org).
7 See Federal Spending | U.S. Treasury Fiscal Data for more information on the breakdown of the US fiscal budget.
© 2023, Federal Reserve Bank of St. Louis. The views expressed are those of the author(s) and do not necessarily reflect official positions of the Federal Reserve Bank of St. Louis or the Federal Reserve System.