
Curve Ball
-
 John Mauldin
- |
- April 1, 2022
- |
- Comments
- |
- View PDF
 John Mauldin
“I would not interpret the currently very flat yield curve as indicating a significant economic slowdown to come.” (and subprime is contained.)
—Ben Bernanke, March 2006
Evidence continues to mount that a recession is coming soon. The latest was this week’s “inverted yield curve” with the 2-year Treasury yield briefly exceeding the 10-year Treasury yield. That’s the opposite of normal. Then again, a bunch of things have been the opposite of normal lately.
We have many indications recession is near. I’ll mention a few others later. I expect a Strange Recession because these are strange times. But that also means the inverted yield curve and other long-standing patterns might not signify what they did in the 1980s. Nonetheless, all this smoke suggests some kind of fire is burning.
The yield curve is really just a symptom. I like to compare it to a fever—not serious in itself, but a sign you have an infection or some other ailment. An inverted yield curve means something is wrong in our economic body. So today we’ll consider what it means. I’ll start by updating a 2018 letter on this topic (see The Misunderstood Flattening Yield Curve). Then we’ll look at some expert perspectives on the current situation.
|
NEW VIDEO SERIES:
|
Definitely Abnormal
“Yield curve” sounds sophisticated but is nothing more than a line showing current interest rates for various maturity periods, with rates on the vertical axis and time on the horizontal. Generally it looks something like this:
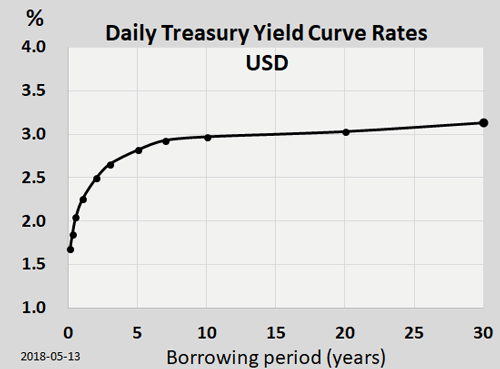
Source: Wikimedia Commons
The yield “curve” can be a curve, a straight line, or a bent line like this one from 2018. Normally it slopes upward from the lower left to the upper right. All the discussion and drama are about the line’s shape and angle.
Here is the current view, with one year ago and two years ago shown for comparison:
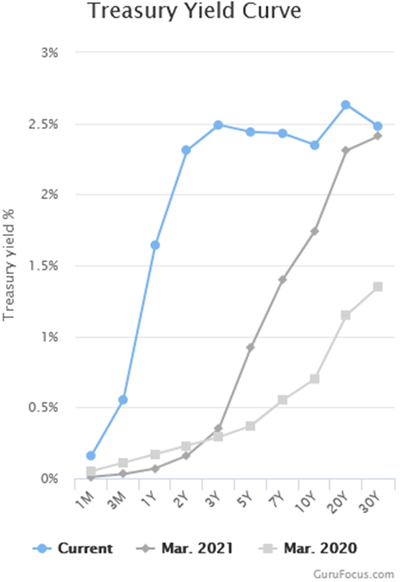
Source: GuruFocus
You can see how interest rates rise quickly from 3-month T-bills out to the 2-year area, then go flat. You can also see it wasn’t like that a year, or even six months, ago. This “flattening” is a new development.
Moreover, the area between 3Y and 10Y actually angles slightly downward. That is what we mean by “inversion.”
Here is another chart from Gavekal showing the changes in the last six months. Will Denyer thinks the yield curve is not signaling recession, at least yet. Will is smarter than I am, but I’m not sure he understands what an inverted yield curve actually predicts.
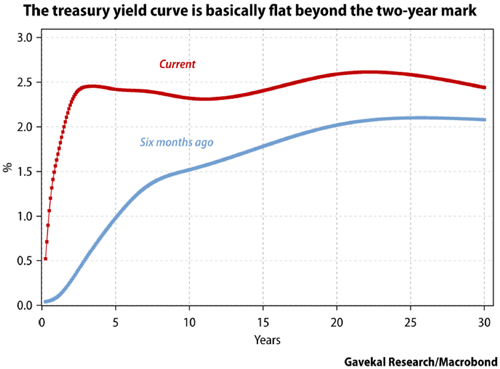
Source: Gavekal Research
Here’s a table showing March’s daily Treasury par yields. Normally you would see numbers increase along each row. I highlighted points where they drop. These are inversions and they are not normal. They seem to be spreading from right to left.
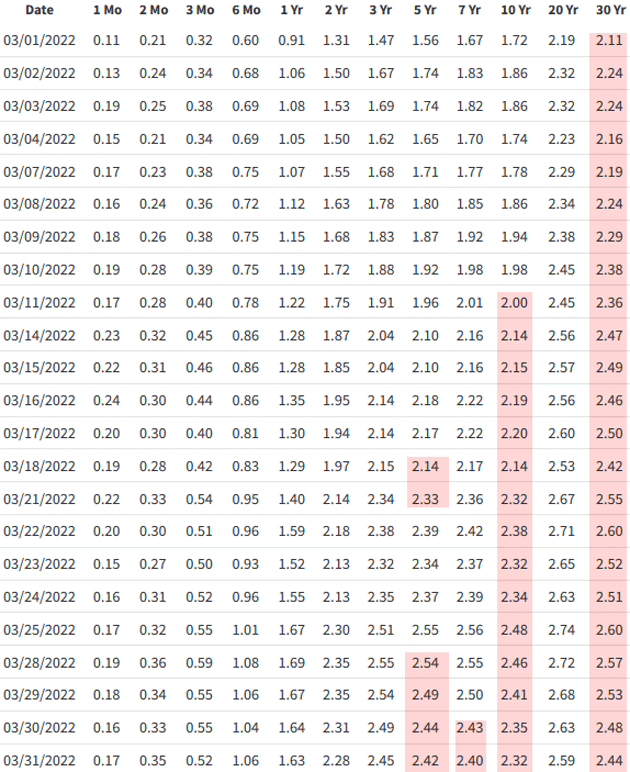
Source: US Treasury
Yields are supposed to reflect risk, and risk grows with time. The chance something bad will happen in the next 10 years is higher than the chance something equally bad will happen in the next two years. Longer-term bond investors should demand higher yields as compensation for that higher risk. Presently they aren’t, or at least not always.
So far, the full yield curve isn’t inverted, only parts of it. But this is definitely abnormal and combined with everything else we know, it’s a ringing alarm bell. The more inverted the yield curve is and the longer it stays that way, the more confident we are that a recession is coming.
|
Special Publication From Our Partners at Jared Dillian Money: Introducing The Wartime Portfolio from Jared Dillian - 7 moves to make right now to protect your portfolio from geopolitical uncertainty. |
Early Predictor
Like what you’re reading?
Get this free newsletter in your inbox every Saturday! Read our privacy policy here.
In a true inversion we would see the entire curve angled down from left to right. That last happened in 2005. Were we in recession then? No, not at all. The economy was booming. In fact, the yield curve stayed inverted until mid-2007. Some of us saw cracks forming in the economy, and said so at the time. But the actual recession would not begin until December 2007.
I began to predict a recession in late 2006. I remember being on Larry Kudlow’s show with Nouriel Roubini and John Rutherford. Larry and John beat us up for our gloom and doom perspective. And you know what? They were right for the next six months. The market went up another 20%, right before it dropped over 50% or more.
That’s a longstanding pattern. The inverted yield curve has been a pretty reliable recession indicator but it shows up far in advance—months or even more than a year. We might better think of it as signaling the cycle’s “blowout” stage. People see the inversion, observe nothing bad happening, then throw caution to the wind.
Another way to illustrate inversions is with a yield spread, i.e., a long-term yield minus a short-term yield. You can graph the difference and it goes below zero when the short-term yield is higher, meaning an inversion exists between those two points on the yield curve. This chart shows the spread between 10-year and one-year Treasury yields:
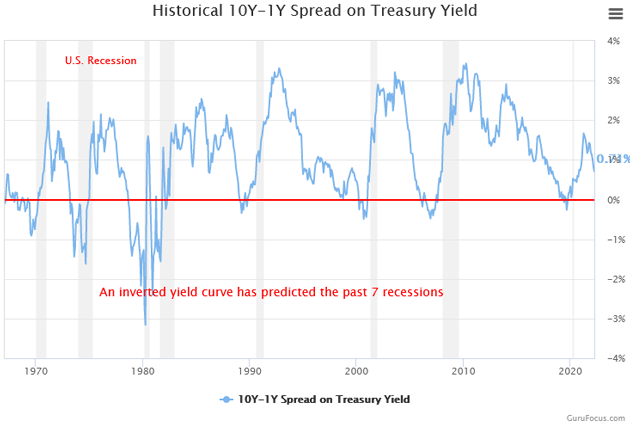
Source: GuruFocus
The gray vertical bars are recessions. You can see how the spread dropped below the 0% line before each one, and is now close to that point again. But notice also how long it stayed inverted before the last recession, and how far in advance. The 10Y‒1Y spread dropped below zero in January 2006, came back above for a little bit, stayed there and was moving higher when the recession finally began. The same happened in 2000.
By the time actual recession arrives the yield curve can, and nearly always does, resume a normal pattern. In an odd way, it appears to me the yield curve is predicting a recovery even as we are actually going into a recession. But then, that’s kind of axiomatic, because there is always a recovery after a recession.
Here’s a slightly different chart showing the 10Y/3M (three months) and 10Y/2Y spreads. That last one is the “tens and twos” you hear traders discussing. It recently plunged and actually dipped below zero last week.
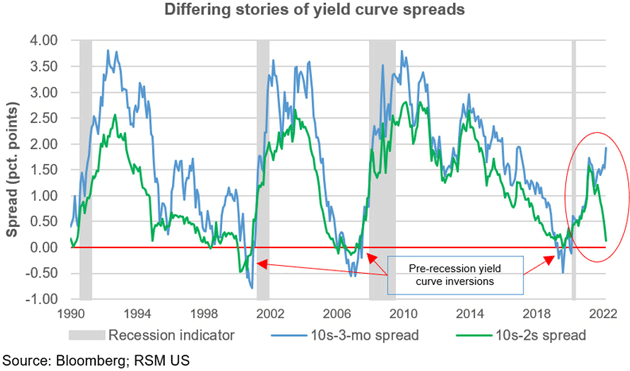
Source: RSM
You can vary the parameters but the broad principle holds pretty well. Yield curve inversions precede recessions by anywhere from a few months up to two years. Oddly, the yield curve actually predicted the pandemic recession long before we knew about the virus. Many analysts, including your humble analyst, noted the economy was slowing markedly in late 2019. We will never know the counterfactual as to whether we would have gone into recession without the pandemic.
That said, yield curve inversion as a recession indicator is not quite as simple as many think.
Witch’s Brew
One of the first to quantify the inverted yield curve/recession connection was economist Campbell Harvey, who is now on the faculty at Duke University. It was the subject for his 1986 University of Chicago doctoral dissertation (short summary here). Others confirmed and expanded on his findings, which are now conventional wisdom on Wall Street.
In the spirit of “go to the source,” I called Campbell this week to ask what he sees in the current data. He started by reminding me that his original idea was to compare a short-term yield with a long-term one. You could pick many different points. He found the 3M/10Y Treasury spread seemed the most reliable. He was also quick to note that his indicator requires measurement over an entire quarter. Inversions of a few days or weeks don’t qualify.
The present situation is a bit odd in that the 2Y/10Y is close to inverted, while the 3M/10Y is not. (Again, look at the green and blue lines in the RSM chart above.) Under Campbell’s rules, that means we don’t have a recession signal. However, even a flat yield curve isn’t good news. It is associated with lower economic growth, as we are seeing right now.
One issue here is that the 3M yield is more sensitive to Federal Reserve policy. It is abnormally and artificially low right now, which makes the spread wider. This will change as the Fed hikes short-term rates. Other things being equal, the Fed’s present trajectory should have a flattening effect on the yield curve, and eventually invert it unless long-term rates rise. Indeed, that’s what the Fed wants: to cool growth, thereby reducing inflation. (Whether it will actually work that way is another discussion.)
(Sidebar: Federal Funds and other short-term rates are abnormally low for this point in the cycle. Given almost 8% inflation and Fed funds at roughly 50 basis points, a truly inverted yield curve isn’t possible unless the Fed hikes far more than most observers believe. Oddly, the FOMC members actually forecast six more rate increases this year and several early next year. It seems the only true believers in the Fed raising rates are the people who will actually do it. We will see.)
The economy is also still recovering from the COVID disruptions and associated changes in business and consumer preferences, plus the extensive supply chain snarls. Then of course we have the major changes sparked by the Russia-Ukraine War and economic sanctions. All these go into a witch’s brew with economic results that are as yet unknown.
Yield Curve Duration Is Important
In June of 1996, Fed economists Arturo Estrella and Frederic S. Mishkin of the Federal Reserve Bank of New York, published a quite important paper titled "The Yield Curve as a Predictor of U.S. Recessions."
Like what you’re reading?
Get this free newsletter in your inbox every Saturday! Read our privacy policy here.
They noted: "The yield curve—specifically, the spread between the interest rates on the 10-year Treasury note and the three-month Treasury bill—is a valuable forecasting tool. It is simple to use and significantly outperforms other financial and macroeconomic indicators in predicting recessions two to six quarters ahead."
Estrella and Mishkin demonstrated that the more negative the 90-day average of the difference between the 90-day Treasury rate and the 10-year bond rate, the more likely it is that we will have a recession within about four quarters. They assign the odds of a recession with each level of the yield curve, but note that the odds at a particular level might be higher today than in the past for a variety of reasons. In subsequent papers, they noted that of 26 different indicators, only a negative yield curve was a truly reliable predictor of recessions. The longer the yield curve remains negative, the more likely there will be a recession.
Thus it was easy to make a recession call/warning in August of 2000. Somewhat premature, but not by much. In 2006, it was easily 12 months. Interestingly, I actually called Fred Mishkin, one of the authors of the Fed study, and asked him if he thought the inverted yield curve then was signaling recession. Long and short, he basically said no.
As for now, the Estrella/Mishkin indicator show low recession odds because we haven’t seen the kind of inversion that occurred in the past. And that’s mainly because the Fed has kept short-term rates so abnormally low. Three-month rates need to get a lot higher to produce that signal.
No Off-Ramp
My friend Jim Bianco generously shared his trader’s perspective in a recent must-read Twitter thread. I’ll quote it in full here, then have some remarks afterward. (Warning: This reads abruptly in spots because he’s breaking a longer discussion into a series of 280-character tweets.)
-
On the yield curve and how to read it: Bottom line * Curves no longer than 2-years (i.e, 3M/2Y) are steepening A LOT. They are signaling many rate hikes are coming. See the table, 12 hikes are now priced in for the next year. Yes... 12!
-
* Curves no shorter than 2-years (i.e., 2Yr/10Yr) are flattening a lot and many are inverting. So, we believe they are signaling the huge number of rate hikes will break something in markets, the economy, and/or the financial plumbing (repo). Details below.
-
2018 Engstrom & Sharpe argued an inverted 10y2y curve did not mean recession. The FOMC was so impressed (or wanted this to be the case) that they invited them to an FOMC meeting to explain it. The curve inverted in 2019 and a year later, recession.
-
We don't know the counterfactual if the pandemic did not happen. That said, we believe there was solid evidence pre-pandemic the economy was beginning to struggle. They are doubling down with an update to their 2018 paper, out Friday.
(Don't Fear) The Yield Curve, Reprise
-
They believe the orange curve matters more; the 3-month yield now versus the swap curve's estimate where 3M yields will be in 6 quarters? For those without a Bloomberg, the blue line is the standard 2yr/3M curve. It is almost the same thing (and goes back further).
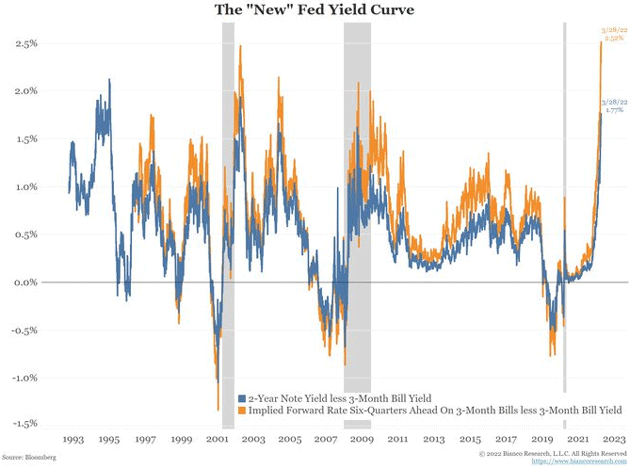
-
This orange yield curve above makes sense. When this curve inverts it means things are already broken and a recession has either started or is inevitable. The Fed is in panic mode cutting rates to stop it. So, with it a record wide curve, no worries, right?
-
Well as the next chart shows, the curves no shorter than 2-year (red, orange, blue) are inverting while curves no longer than 2-year (green) are going in the opposite direction massively steepening. How do we reconcile this?
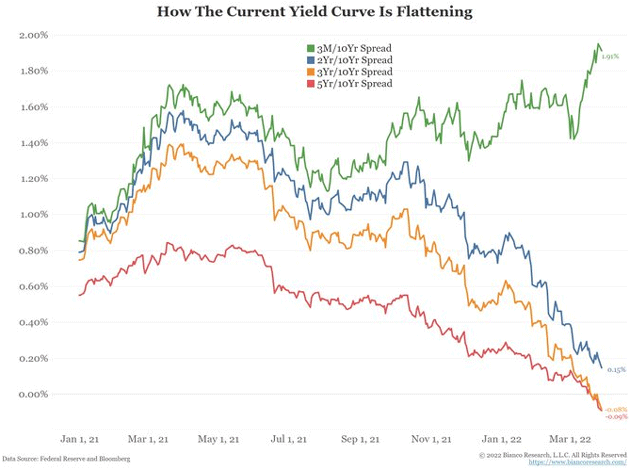
-
The Fed starts hiking for valid reasons, like inflation. The problem is they don't know when to stop, overdo it, and break something. Why would the Fed go too far? Because nothing matters but inflation, and they have to get it down, as Nate Silver noted.
-
This is why we have been arguing the Fed has no choice. They have to hike until it hurts. And if that causes a recession or bear market, so be it. I believe this is what the short and long yield curves are signaling. No recession now but headed that way with no off-ramp.
John here again. I have to agree with Jim’s bottom line: The Fed is going to hike until it hurts. Powell and his crew hope to engineer the fabled “soft landing.” I really doubt they can do it.
What gives me pause, though, is whether Powell really has the Volcker-like stomach needed to stay on this course. Make no mistake, the Fed’s rate hikes and ending its asset purchases will cause a lot of pain, both to financial markets and workers/consumers, and with no guarantee the desired effects will follow.
Like what you’re reading?
Get this free newsletter in your inbox every Saturday! Read our privacy policy here.
And if wage growth is any guide, the Fed is way behind the curve. This next chart suggests it will take more than a few rate hikes to control inflation.
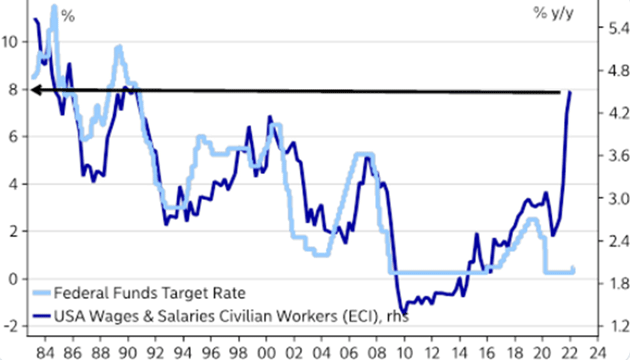
Source: Andreas Steno
I know people who might take the other side of this bet. Dave Rosenberg and Stephanie Pomboy, for instance, both think the economy will slow quickly this year and we may even be talking about deflation soon. That’s not as crazy as it sounds. Prior to COVID, the world was moving into a deeper disinflationary/deflationary period. Rosie and Stephanie just assume that trend will resume after inflation is under control, brought about more by recession than Federal Reserve policy.
A Few Recession Markers
Peter Boockvar noted this morning that Redfin, which has a good read on the housing market, is seeing signs of a slowdown.
“Here's another important anecdote I believe as it's an indirect call ultimately on consumer spending. The CEO of FreightWaves, Craig Fuller, whose firm has their finger on the pulse of transportation like no other published a piece on their website titled ‘Why I believe a freight recession is imminent.’ This comes a week after he published an article titled ‘Just 3 years after 2019's trucking bloodbath, another is on the way.’ The 2019 'bloodbath' by the way was in response to the tariff battle with China which put US manufacturing into a recession.”
Further, from Quill Intelligence, the following chart shows that inventories are building faster than new orders (yellow line).
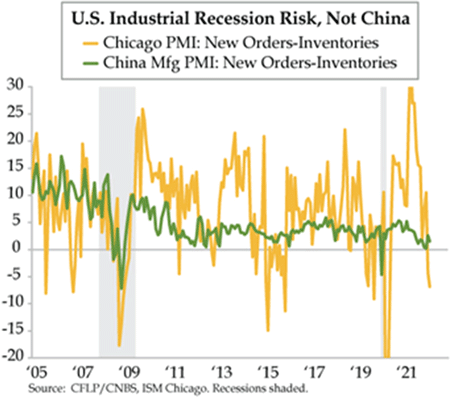
Source: Quill Intelligence
“For the last two months, supply, as in Inventories, has run ahead of demand, a.k.a. New Orders; the absolute level of the negative spread (yellow line) puts it on par with the 2015‒16 Industrial Recession and the 2018‒19 trade war.”
There is absolutely no way to precisely predict when a recession begins. My instinct tells me this will not be a 12-month wait. I think things just continue to slow down and one day we’ll look up and see a recession. And then a little bit later we’ll be growing again. That’s how these things work…
Helping Refugees in Ukraine
Last week friends here in Puerto Rico organized a large and very successful fundraiser to help Ukrainian refugees. It turns out the local Jesuit university can directly fund the Jesuit Refugee Service in Poland. (I have met the priest who runs the local Jesuit high school. These are the good guys.) They have organized buses to pick up refugees and bring them 15 miles into Poland where services are set up to handle them. This bypasses human traffickers and other pond scum at the border crossings, some of whom offer transportation for thousands of dollars. The Jesuits and their volunteers do it for free.
As a bit of a bonus, they fill their vans with medical supplies and take them into Ukraine and return with women and children. The video we saw of women leaving their homes with no idea where to go or how to survive were quite moving.
You can click here to join me in supporting Ukrainian refugees. Your donation will go 100% to the Jesuit Refugee Service in Poland. They can support a refugee for about $4 per day, plus the cost of transportation. They presented a very detailed budget. I was very impressed with the quality of the people running the operation.
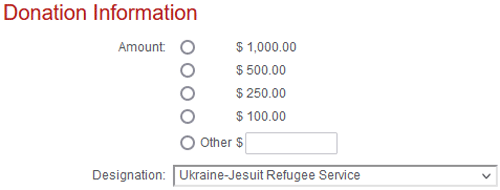
In the first section you will designate the amount of your donation. There is a dropdown menu which will default to “Fondo General.” You’ll need to change that part. If you click on the arrow you will see the choice for the Jesuit Refugee Service in Ukraine. Make sure it looks like this:
While this isn’t anti-tank weapons or planes, it is critical and life supporting. We need to help the refugees and the families who are taking them in. Please be as generous as you can. They can take cryptocurrency, wire transfers, etc., through another facility.
And with that I will hit the send button and wish you a great week! And don’t forget to follow me on Twitter!
Your troubled by refugees analyst,

John Mauldin
P.S. If you like my letters, you'll love reading Over My Shoulder with serious economic analysis from my global network, at a surprisingly affordable price. Click here to learn more.
Tags
Suggested Reading...
|
|

Did someone forward this article to you?
Click here to get Thoughts from the Frontline in your inbox every Saturday.
