
Crestmont Research develops provocative insights on the financial markets, including the stock market, interest rates, and investment philosophy. The research focuses on the drivers and characteristics of secular stock market cycles, the impact of the inflation rate and interest rates on the stock and bond markets, and a conceptual approach toward investment strategy that is applicable to the current market environment.
Research Objectives
The objective of the research and its publication on this site is to present rational perspectives based upon a diligent analysis of historical data. Through understanding and developing perspectives on that data, vital new knowledge is formulated. Armed with that knowledge, we can then start to make informed decisions.
Crestmont’s research is intended to be observation-based rather than prediction-oriented. Its purpose is to provide information and perspectives to assist in rational decision-making. The research does not provide predictions or recommendations on investment alternatives, although you may find its implications for investment strategy quite compelling.
Stock Market
The overall market is highly volatile and affected by generally long secular cycles. You may wonder is it worth the risk?. Further, returns in the stock market depend upon the level of and trend for the inflation rate. In this section, you’ll gain insights toward the obvious question: what can we expect from here?.
Ten, twenty, or even thirty years is not long enough to ensure successful returns in the stock market. Current and recent levels for the P/E ratio suggest that expected returns will be disappointing for many investors. Pundits are professing, “Returns will improve when the economy begins to recover!” But hope is not a strategy.
Though traditional wisdom relates P/E ratios to interest rates, that relationship works only in periods of positive inflation. With the risk of higher inflation or deflation looming on the horizon, the analysis titled “P/E Ratios & Inflation” will clarify that P/E’s are driven by inflation. As well, see “Stock Market Returns & Volatility” for a surprisingly strong relationship between the level of volatility in the stock market and its direction.
“Financial Physics” represents the interconnected relationships among several key elements in the economy and the financial markets–relationships that determine the stock market’s overall direction. This presentation will provide a highly provocative and insightful perspective on the relationship of the economy (the source of wealth) and the equity markets (the measure of equity wealth). Whereas other presentations present analyses of historical data to provide perspectives, this analysis is dedicated to exploring the fundamental factors and economic relationships that drive trends and valuations in the financial markets.
Harry Markowitz, Nobel Prize co-recipient for Modern Portfolio Theory and the Capital Asset Pricing Model, published “Portfolio Selection” in The Journal of Finance during 1952. He led with a critical point: “The process of selecting a portfolio may be divided into two stages. The first stage starts with observation and experience and ends with beliefs about the future performances of available securities. The second stage starts with the relevant beliefs about future performances and ends with the choice of the portfolio. This paper is concerned with the second stage.” As Markowitz emphasizes, it is the investor’s responsibility to use “observation and experience” to develop “beliefs about the future performances.” Crestmont’s research is developed to provide practical insights for investors who don’t have 75 to 100 years to wait for historical average returns.
Interest Rates
Short-term interest rates (one year or less) are generally determined by the Federal Reserve; long-term interest rate yields are driven by the inflation rate or inflation expectations. The relationship between interest rates and inflation was not evident before the 1960’s. Current research now suggests implications for the future.
Though there are occasional, very limited periods that break the general rule, Crestmont Research’s The 6/50 Rule states: “Interest rates will change by at least 50 basis points (0.5%) within the next 6 months.” There’s almost 50 years of history–virtually without exception–in our favor. Chances are that the change will be a good bit more than that, too. See the details and charts titled “The 6/50 Rule.”
Economy
Uncertainties about the economy pose a unique crossroads for the current decade and beyond. Further research and analysis is needed to assess conventional wisdom for myth and insight.
Books
Unexpected Returns:
Understanding Secular Stock Market Cycles
Before you read any how-to investment books or seek financial advice, read Unexpected Returns, the essential resource for investors and investment professionals who want to understand how and why the financial markets are not the same now as they were in 1980s and 1990s. In addition to explaining the fundamentals, this award-winning book takes you on a graphic journey through seasons of the market, tying together economics and finance to explain the stock market’s cycles. Using comprehensive full-color charts and graphs, it offers an in-depth exploration of what has changed over the past five years – and what you can do about it to avoid disappointment with your investments. This unique combination of investment science and investment art will enable you to differentiate between irrational hope and a rational view of the current financial markets. Based on years of meticulous research, Unexpected Returns provides the sensible conclusions that will drive your future investment choices and give you the confidence to rely on your investment outlook, whatever your financial strategy.
Probable Outcomes:
Secular Stock Market Insights
Probable Outcomes continues the Crestmont Research tradition of extensive full-color charts and graphs that enable investors and advisors to differentiate between irrational hope and a rational view of the stock market. This book’s empowering insights prepare you to take action during the current period of below-average returns. The unique combination of investment science and investment art explores the market from several perspectives and addresses the significant implications for a broad range of investors. Beyond concepts, Ed Easterling delivers a dramatic analysis of the likely course for the stock market over the 2010 decade. Investors and advisors will benefit from this timely outlook and its message of reasonable expectations and value-added investing. This essential resource offers a compelling understanding of the key fundamental principles that drive the stock market. Derived from years of meticulous research, Probable Outcomes provides sensible conclusions that will guide your future investment choices and allow you to invest with confidence, whatever your financial strategy.
About
Crestmont Research primarily develops and publishes research in the form of charts and graphs to provide investors and market spectators with poignant perspectives on the financial markets. The objective is to impart insights about the reality of the markets. Occasionally, articles are written when graphics would not be appropriate or when requested by specific publications or clients. Crestmont has retained all rights to the following articles and welcomes inquiries regarding publication in periodicals and newsletters.
We solicit your insights, whether supporting or contradicting our presentations. They will assist in furthering our research. Contact us at Info[at]CrestmontResearch.com, or use this contact form.
Featured Items
Last Updated
Oct 9, 2023
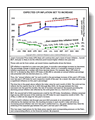
Inflation: Not Done Yet?
The big story for the remainder of 2023 will likely be inflation. Fed Chairman Powell intentionally avoided the implications underlying words like “pause” or “skip” when he said the Fed would “make our decisions meeting by meeting, based on the totality of incoming data.” Let’s look at a structural element that will influence the upcoming inflation data.
June’s Consumer Price Index (CPI) likely will continue this year’s underlying trend of lower inflation… hurrah! But, mid-year is likely to be the inflection point toward higher inflation reports into year-end. Those calls are far from certain, yet recent history significantly drives the future.
CPI inflation is reported on a year-over-year basis as a percentage increase (or decrease). The percentage change is based on the CPI Index, which is a cumulative measure of price inflation expressed as a number with three decimal places.
For example, May’s CPI Index of 304.127 is divided by May 2022’s CPI Index of 292.296 to calculate an annual inflation percentage rate presented with one decimal place (i.e., 4.0%).
Thus, the “annual inflation rate” for each month is the percentage increase of this year’s CPI Index over last year’s CPI Index for each respective month of the year. As a result, the value last year significantly influences this year’s percentage!
The blue line in this graph reflects the index value for each month of 2022. The solid red line reflects the five reports thus far in 2023 (through May 2023). As the gap between the lines narrowed over the past five months, the rate of increase narrowed (i.e., decreased), providing the declining annual inflation rate reflected by the solid green line (i.e., from 6.4% to 4.0%).
However, the second half of 2022 experienced a stall for the CPI Index. Nonetheless, inflation remained high across 2022 because of the relatively low CPI Index for each respective month of 2021. The STALL in 2022 set the stage for this year’s increase.
If each month’s inflation rate through year-end 2023 proceeds at an annualized 3% rate (as reflected by the dashed red line), the resulting increase in each month’s index will drive an increasing annual inflation rate over last year’s stalled level (i.e., the green dashed line). Note the widening of the expected gap for the next six months between this year’s and last year’s CPI Index.
A constant 0.247% monthly inflation rate (i.e., a 3% annualized rate) for the rest of 2023 is very unlikely. Instead, this analysis aims to identify and communicate key factors that will impact the reported inflation measures through year-end.
The progression of inflation has major implications for the likely press reports (and the corresponding pressure on the Fed)… and the compounding effects that both could have on the financial markets.

Outlook: How Crestmont Research Forecasts
The first principle of investing is that “past performance is not indicative of future results.” Yet, many in the investment industry and investor community rely heavily on the rear-view mirror. Product summaries boast returns for the past 1, 3, 5, and 10 years. Some investors buy currently hot stocks as they cull losers without much regard for their potential. Too often, it’s human nature for us to anchor on yesterday’s trend to extrapolate tomorrow’s outcome.
The most common misunderstanding about Crestmont Research is that its articles and charts follow that industry norm. But, Crestmont’s identification of secular stock market cycles is not based upon recent eras of strong or weak returns. Instead, Crestmont is keenly focused on the outlook for most investors’ horizons—periods of five to twenty years. Secular calls are driven by current conditions and outlook, not by past trends.
This two-page article describes the key principles underlying Crestmont’s research and related charts and writings. It closes with links to selected pieces that epitomize Crestmont’s work.
The Big Shift: A Secular Realignment of Profits and P/E
Why are reported profits for the S&P 500 Index so much higher than normalized profits? Although implied earnings per share (EPS) under Shiller’s CAPE P/E10 and Crestmont’s normalized P/E are expected to be near $90 in 2019, the current forecast for as-reported GAAP EPS is $165.
Why are wages relatively stagnant overall (and declining as a percentage of the economy) while corporate profits increase as a percentage of GDP?
Why does the stock market appear so overvalued to many analysts when, in reality, it may be near fairly valued?
In summary, (1) increased profit margins are the result of slower economic growth; (2) the related increase in EPS will be offset by a lower market P/E and thus will not provide stock market gains; and (3) future returns will remain muted despite an apparently lower level for P/E in the future.
NOTE: the material in this article is so provocative that the concepts are not affecting other material on the website at this time.