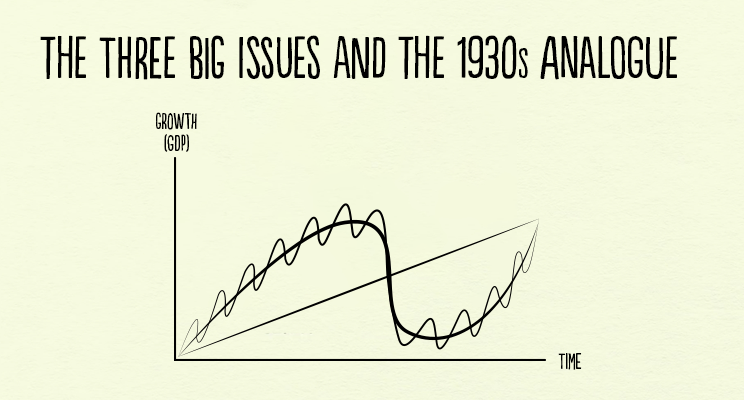
The Three Big Issues and the 1930s Analogue
The most important forces that now exist are:
1) The End of the Long-Term Debt Cycle (When Central Banks Are No Longer Effective)
+
2) The Large Wealth Gap and Political Polarity
+
3) A Rising World Power Challenging an Existing World Power
=
The Bond Blow-Off, Rising Gold Prices, and the Late 1930s Analogue
In other words now 1) central banks have limited ability to stimulate, 2) there is large wealth and political polarity and 3) there is a conflict between China as a rising power and the U.S. as an existing world power. If/when there is an economic downturn, that will produce serious problems in ways that are analogous to the ways that the confluence of those three influences produced serious problems in the late 1930s.
Before I get into the meat of what I hope to convey, I will repeat my simple timeless and universal template for understanding and anticipating what is happening in the economy and markets.
My Template
There are four important influences that drive economies and markets:
- Productivity
- The short-term debt/business cycle
- The long-term debt cycle
- Politics (within countries and between countries).
There are three equilibriums:
- Debt growth is in line with the income growth required to service the debt,
- The economy’s operating rate is neither too high (because that will produce unacceptable inflation and inefficiencies) nor too low (because economically depressed levels of activity will produce unacceptable pain and political changes), and
- The projected returns of cash are below the projected returns of bonds, which are below the projected returns of equities and the projected returns of other “risky assets.”
And there are two levers that the government has to try to bring things into equilibrium:
- Monetary policy
- Fiscal policy
The equilibriums move around in relation to each other to produce changes in each like a perpetual motion machine, simultaneously trying to find their equilibrium level. When there are big deviations from one or more of the equilibriums, the forces and policy levers react in ways that one can pretty much expect in order to move them toward their equilibriums. For example, when growth and inflation fall to lower than the desired equilibrium levels, central banks will ease monetary policies which lowers the short term interest rate relative to expected bond returns, expected returns on equities, and expected inflation. Expected bond returns, equity returns, and inflation themselves change in response to changes in expected conditions (e.g. if expected growth is falling, bond yields will fall and stock prices will fall). These price changes happen until debt and spending growth pick up to shift growth and inflation back toward inflation. And of course all this affects politics (because political changes will happen if the equilibriums get too far out of line), which affects fiscal and monetary policy. More simply and most importantly said, the central bank has the stimulant which can be injected or withdrawn and cause these things to change most quickly. Fiscal policy, which changes taxes and spending in politically motivated ways, can also be changed to be more stimulative or less stimulative in response to what is needed but that happens in lagging and highly inefficient ways.
For a simpler explanation of this template see my 30-minute animated video “How the Economic Machine Works” and for a more comprehensive explanation see my book Understanding the Principles of Big Debt Crises, which is available free as a PDF here or in print on Amazon. Also, to learn more about our extensive debt cycle research, please visit our debt crises research library on Bridgewater.com.
Looking at What is Happening Now in the Context of That Template
Regarding the above template and where we are now, in my opinion, the most important things that are happening (which last happened in the late 1930s) are a) we are approaching the ends of both the short-term and long-term debt cycles in the world’s three major reserve currencies, while b) the debt and non-debt obligations (e.g., healthcare and pensions) that are coming at us are larger than the incomes that are required to fund them, c) large wealth and political gaps are producing political conflicts within countries that are characterized by larger and more extreme levels of internal conflicts between the rich and the poor and between capitalists and socialists, d) external politics is driven by the rising of an emerging power (China) to challenge the existing world power (the U.S.), which is leading to a more extreme external conflict and will eventually lead to a change in the world order, and e) the excess expected returns of bonds is compressing relative to the returns on the cash rates central banks are providing.
As for monetary policy and fiscal policy responses, it seems to me that we are classically in the late stages of the long term debt cycle when central banks’ power to ease in order to reverse an economic downturn is coming to an end because:
- Monetary Policy 1 (i.e., the ability to lower interest rates) doesn’t work effectively because interest rates get so low that lowering them enough to stimulate growth doesn’t work well,
- Monetary Policy 2 (i.e., printing money and buying financial assets) doesn’t work well because that doesn’t produce adequate credit in the real economy (as distinct from credit growth to leverage up investment assets), so there is “pushing on a string.” That creates the need for…
- Monetary Policy 3 (large budget deficits and monetizing of them) which is problematic especially in this highly politicized and undisciplined environment.
More specifically, central bank policies will push short-term and long-term real and nominal interest rates very low and print money to buy financial assets because they will need to set short-term interest rates as low as possible due to the large debt and other obligations (e.g. pensions and healthcare obligation) that are coming due and because of weakness in the economy and low inflation. Their hope will be that doing so will drive the expected returns of cash below the expected returns of bonds, but that won’t work well because a) these rates are too close to their floors, b) there is a weakening in growth and inflation expectations which is also lowering the expected returns of equities, c) real rates need to go very low because of the large debt and other obligations coming due, and d) the purchases of financial assets by central banks stays in the hands of investors rather than trickles down to most of the economy (which worsens the wealth gap and the populist political responses). This has happened at a time when investors have become increasingly leveraged long due to the low interest rates and their increased liquidity. As a result we see the market driving down short term rates while central banks are also turning more toward long-term interest rate and yield curve controls, just as they did from the late 1930s through most of the 1940s.
To put this interest rate situation in perspective, see the long-term debt/interest rate wave in the following chart. As shown below, there was a big inflationary blow-off that drove interest rates into a blow-off in 1980-82. During that period, Paul Volcker raised real and nominal interest rates to what were called the highest levels “since the birth of Jesus Christ,” which caused the reversal.

During the period leading into the 1980-82 peak, we saw the blow-off in gold. The below chart shows the gold price from 1944 (near the end of the war and the beginning of the Bretton Woods monetary system) into the 1980-82 period (the end of the inflationary blow-off). Note that the bull move in gold began in 1971, when the Bretton Woods monetary system that linked the dollar to gold broke down and was replaced by the current fiat monetary system. The de-linking of the dollar from gold set off that big move. During the resulting inflationary/gold blow-off, there was the big bear move in bonds that reversed with the extremely tight monetary policies of 1979-82.

Since then, we have had a mirror-like symmetrical reversal (a dis/deflationary blow-off). Look at the current inflation rates at the current cyclical peaks (i.e. not much inflation despite the world economy and financial markets being near a peak and despite all the central banks’ money printing) and imagine what they will be at the next cyclical lows. That is because there are strong deflationary forces at work as productive capacity has increased greatly. These forces are creating the need for extremely loose monetary policies that are forcing central banks to drive interest rates to such low levels and will lead to enormous deficits that are monetized, which is creating the blow-off in bonds that is the reciprocal of the 1980-82 blow-off in gold. The charts below show the 30-year T-bond returns from that 1980-82 period until now, which highlight the blow-off in bonds.

To understand the current period, I recommend that you understand the workings of the 1935-45 period closely, which is the last time similar forces were at work to produce a similar dynamic.
Please understand that I’m not saying that the past is prologue in an identical way. What I am saying that the basic cause/effect relationships are analogous: a) approaching the ends of the short-term and long-term debt cycles, while b) the internal politics is driven by large wealth and political gaps, which are producing large internal conflicts between the rich and the poor and between capitalists and socialists, and c) the external political conflict that is driven by the rising of an emerging power to challenge the existing world power, leading to significant external conflict that eventually leads to a change in the world order. As a result, there is a lot to be learned by understanding the mechanics of what happened then (and in other analogous times before then) in order to understand the mechanics of what is happening now. It is also worth understanding how paradigm shifts work and how to diversify well to protect oneself against them.
---------------------------------------------------------------------------------------------------------------
Bridgewater Daily Observations is prepared by and is the property of Bridgewater Associates, LP and is circulated for informational and educational purposes only. There is no consideration given to the specific investment needs, objectives or tolerances of any of the recipients. Additionally, Bridgewater's actual investment positions may, and often will, vary from its conclusions discussed herein based on any number of factors, such as client investment restrictions, portfolio rebalancing and transactions costs, among others. Recipients should consult their own advisors, including tax advisors, before making any investment decision. This report is not an offer to sell or the solicitation of an offer to buy the securities or other instruments mentioned.
Bridgewater research utilizes data and information from public, private and internal sources, including data from actual Bridgewater trades. Sources include the Australian Bureau of Statistics, Barclays Capital Inc., Bloomberg Finance L.P., CBRE, Inc., CEIC Data Company Ltd., Consensus Economics Inc., Corelogic, Inc., CoStar Realty Information, Inc., CreditSights, Inc., Credit Market Analysis Ltd., Dealogic LLC, DTCC Data Repository (U.S.), LLC, Ecoanalitica, EPFR Global, Eurasia Group Ltd., European Money Markets Institute – EMMI, Factset Research Systems, Inc., The Financial Times Limited, GaveKal Research Ltd., Global Financial Data, Inc., Haver Analytics, Inc., The Investment Funds Institute of Canada, Intercontinental Exchange (ICE), International Energy Agency, Lombard Street Research, Markit Economics Limited, Mergent, Inc., Metals Focus Ltd, Moody’s Analytics, Inc., MSCI, Inc., National Bureau of Economic Research, Organisation for Economic Cooperation and Development, Pensions & Investments Research Center, Renwood Realtytrac, LLC RP Data Ltd, Rystad Energy, Inc., S&P Global Market Intelligence Inc., Sentix Gmbh, Spears & Associates, Inc., State Street Bank and Trust Company, Sun Hung Kai Financial (UK), Refinitiv, Tokyo Stock Exchange, United Nations, US Department of Commerce, Wind Information (Shanghai) Co Ltd, Wood Mackenzie Limited, World Bureau of Metal Statistics, and World Economic Forum. While we consider information from external sources to be reliable, we do not assume responsibility for its accuracy.
The views expressed herein are solely those of Bridgewater as of the date of this report and are subject to change without notice. Bridgewater may have a significant financial interest in one or more of the positions and/or securities or derivatives discussed. Those responsible for preparing this report receive compensation based upon various factors, including, among other things, the quality of their work and firm revenues.
Physician Executive, Serial Entrepreneur, Digital Health Evangelist, Veteran
2ysuch insightful
Managing Director at Capital Development Solutions
3yRay, and others, i am no economist, just wondering if you need to interpret the long term gold price with caution as i understand the price was artificially controlled during backing? I could be way off track. BTW, love your posts.
Generalist, Senior Commercial Leader with 18+ Years of Experience in South-East Asia and Japan
4y“...cause/effect relationship...” many decision makers intend to ignore this basic through - a must read
Personal CFO | I give personalized financial advice in your best interest AND help you execute the advice
4ySo what’s the takeaway here? Fairly sure I am inferring correctly, but action list not present.
CFO @ Laborgh Investment GmbH | Real Estate Investments
4yRay, how is the end of the long-term debt cycle transforming into the rebirth of a new one? It seems to me that debt had first been substantially decreased before the birth of a new cycle in the fifties and levering up again. What are the mechanisms that will force debt levels down and what are the mechanisms for being low enough before levering up again? It seems to me that debt has been staying high this time so far compared to last time around. Other than a small initial dent it remains high. So my question to you is: What keeps debt levels from just zig-sawing at high levels and instead will force it down substantially? Or is this time different and debt will indeed remain high? I'm very grateful if you could explain. I have been looking for answers everywhere in your book and papers. Thanks so much for this and all other great articles!