Investors, business owners and consumers should be heeding the message that the inverted yield curve is sending, according to the researcher who pioneered the economic forecasting model.
Duke University professor Campbell Harvey said people shouldn't wait for the economic downturn he anticipates before taking preventive measures.
"This is the time where you need to reflect upon your strategy. It's actually easy to manage assets when the economy is booming. It's much more difficult to manage into a turning point," Harvey told Josh Brown, CEO and co-founder of Ritholtz Wealth Management and a CNBC "Fast Money" contributor, in an interview for "The Compound" on YouTube. "It's way better to have a plan to go by than to find yourself in a situation where the recession hits and you have to improvise."
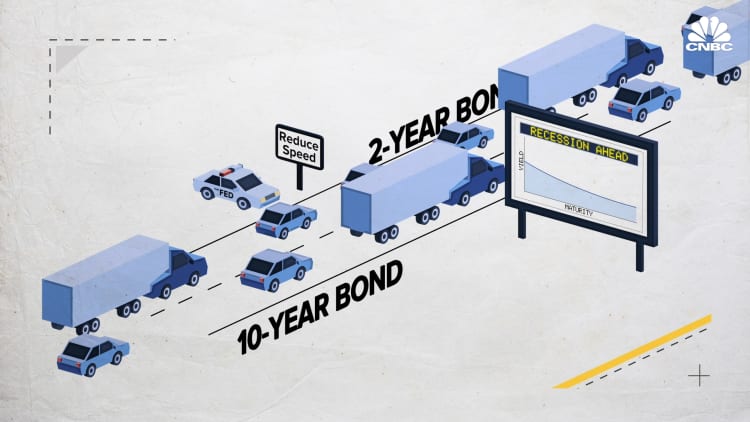
Harvey has led work in research on inverted curves, which happen when short-term Treasury yields are higher than those with longer duration. During his research, first revealed in 1986, he found that an inversion between the 3-month and 10-year Treasurys has foretold the past seven recessions since 1950. At that point, there had been four successful cases; since then, three more have occurred.
In the most recent cycle, that part of the curve first inverted briefly in March then turned lower again in May where it has stayed since.
Harvey said the curve needs to stay inverted for three months to be reliable, so in this instance the duration means the indicator is "flashing code red" for a recession.
"It's not normal. It's something that foreshadows bad times," he said.
The one bright spot, he said, is that those watching the indicator can, and sometimes do, plan ahead. The inversion is not a coincident indicator but rather one that points to downturns six to 18 months or so in the future. So businesses can react to it, for instance, by delaying spending plans until the storm passes.
"That delay could lead to slower growth, but it's possible to look at this as risk management," Harvey said. "You cut back spending somewhat, but you avoid that very sharp hard landing. So it's possible that the self-fulfilling prophecy injects a different level of risk management. We could avoid a recession [and] just have slower growth."
Federal Reserve officials consider an inverted curve as one input into how they assess the economy, Chairman Jerome Powell said Tuesday.
"When the curve is inverted, we focus very carefully on that and it's not something that you need to deal with immediately," he said following a speech in Denver. "It is something that it wouldn't be comfortable to be in that state of affairs for an extended period of time."
Harvey's conclusions about the yield curve dovetail with a 1996 New York Fed paper that also saw a relationship between inversions in the 3-month/10-year part of the curve and recessions. Subsequently, the curve also inverted before the financial crisis that exploded in 2008.
Some market participants, though, focus on the spread between the 2- and 10-year notes. That part of the curve inverted briefly in late August but turned back positive and has stayed there, though the gap was only about 9 basis points as of early Tuesday trading.
There's also no guarantee that the inversion will tank stock prices: Research earlier this year from economists Eugene Fama and Kenneth French found no correlation between an inversion and an equity market that underperformed government bonds.